- A new Food Network Wizard for modeling end-to-end food manufacturing and distribution
- Fixed 5 major bugs, and several minor ones
- Improved NVU hide/show performance substantially (should be at least 2x faster)
- Optimized some low-level functions for speed, should make most of the product feel a little zippier.
- Added many-to-one and one-to-many Auto Sequence buttons, to allow you to select a single center as an originating center, and multiple destination centers (or vice versa) and add tag sequence arrows. Also added the same tools, but for pipe arrows.
- Added smarter units converter detection, so that if you don't add a quick time center we add whatever units are missing and make you fill them out before we allow solve to run.
- Now applying hide/show settings when you drop shapes out from a quick stencil.
- Added a new dialog for controlling hide/show of variable names, which only shows the variables currently on the map, in alphabetic order. This is currently only available in the Beta Tab.
- Added double-click to edit a variable in the List Variables dialog. This dialog was new in like v6.31 I think, and basically it's like Visio's Custom Properties window, so you leave the dialog open and when you select a center we show you all the data on that center, hidden and visible. Now you can double click a variable to edit it.
- Added beta tools for standardizing properties on all kaizen shapes on a page, as well as 2-way Excel import/export of kaizen data. This is barely out of alpha testing, so be cautious in using it and know that there's a possibility of losing your data if you use it.
Wednesday, November 27, 2013
eVSM v6.32 released
We've just released a new update to eVSM, v6.32, which has the following enhancements:

Thursday, November 21, 2013
Sketcher Image Import
OK so I last talked about the eVSM Beta Ribbon, so I'm going to talk about one of the beta tools we've had sitting around for about 8 months: Sketcher Image Import
First, a quick description of the Sketcher, since I haven't written about it. We created the eVSM Sketch module to help people translate a map from pencil/paper to an eVSM map as quickly and painlessly as possible. The idea is, you "sketch" a VSM using simple VSM shapes, either directly on a picture of the wall map, or while looking at a wall map. Then, you right-click one of the VSM shapes and add data to the map, and we add in all the data blocks for your selected stencil.

So one thing we've run into during training on the Sketcher, is it takes a bit of effort to import these pictures and scale them and position them and make sure the image doesn't get in the way of drawing. It's a pain, because most casual eVSM users don't know how to do all this within Visio.
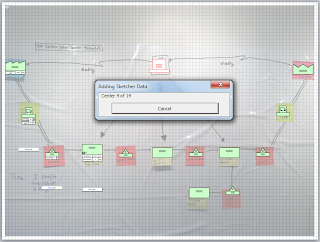
So, I created a tool to help alleviate this pain. You select your image file, then you get a preview of the image.



First, a quick description of the Sketcher, since I haven't written about it. We created the eVSM Sketch module to help people translate a map from pencil/paper to an eVSM map as quickly and painlessly as possible. The idea is, you "sketch" a VSM using simple VSM shapes, either directly on a picture of the wall map, or while looking at a wall map. Then, you right-click one of the VSM shapes and add data to the map, and we add in all the data blocks for your selected stencil.
Example Sketcher map
So one thing we've run into during training on the Sketcher, is it takes a bit of effort to import these pictures and scale them and position them and make sure the image doesn't get in the way of drawing. It's a pain, because most casual eVSM users don't know how to do all this within Visio.
So, I created a tool to help alleviate this pain. You select your image file, then you get a preview of the image.

Sketcher Image Import dialog
From there, you pick two points on the image, to help establish scale. So for a post it map I would click on the top left corner of a post-it, then the top right corner, and type '1.5' into the scale text box. This tells the tool that however many pixels makes up the width of a post-it in this picture should equate to 1.5" on the VSM page. A post-it is actually 3"x3", but in eVMS our shapes are usually 1.5" wide.
Then, you just click the 'Load to Map' button, and we import the image to Visio, and put it on a locked, semi-transparent layer on your page.

Completed Sketch
After that, you can start dropping out our Sketcher shapes on top of the picture, copy text over, and maybe even add your data blocks.
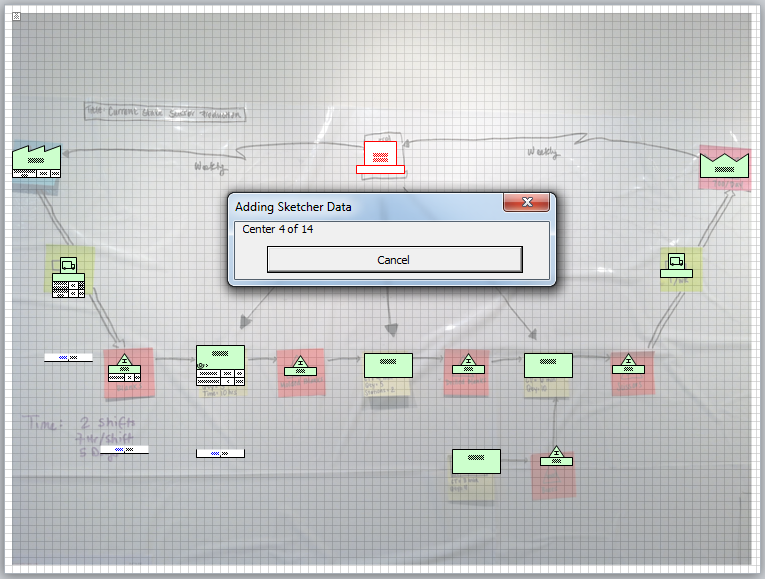
Auto-adding data
So copying data from the image can be pretty tricky, usually because it's hard to read handwriting when the pictures are usually taken from somewhat far away. Also the transparency doesn't help, but turning off the Visio grid can help. But we usually will just go post-it by post-it, and enter data.
After your sketch is complete, you can complete the transformation to a regular map, by using the Sketcher Align tool, which is also currently only in the Beta toolbar. This tool tries to recognize the spatial relationships between all the Sketcher shapes on the page, and lay the map out for you as you would if you had just used our quick stencils.

Aligned map
The Sketcher Align tool used to be in the main toolbar, but during our training sessions users really really hated it, but I think we've improved it since then. Once we got Undo to work with it, I think it became a little more popular, since it's not always great at aligning things. One thing to note here is, I actually copied the Sketch onto a new page, without the post-it picture as a background.
Thursday, November 14, 2013
eVSM Beta Toolbar
One thing we haven't previously made public (that I'm aware of), is a beta toolbar/ribbon in eVSM v6. This is where we keep some tools/features we're working on that aren't quite done yet. Sometimes they are done, and we don't believe them to be mainstream enough to warrant taking up space in the main eVSM ribbon/toolbar.
So with every copy of eVSM v6 we ship two ribbon/toolbar files, in the Program Files\eVSM\Setup\Solutions folder. The main ribbon is stored in the eVSMIconsLGR.xml, and contains the data for building just the main eVSM toolbar.
The second file, when shipped, is called eVSMIconsLGRDev.txt. If you want access to the beta ribbon, just rename that file's extension to XML, and the next time you start eVSM you'll see two new ribbons/toolbars in addition to the main eVSM ribbon. One is the eVSM Beta ribbon, and the other is a Developer Tools ribbon, for anyone who wants to build their own stencils.
I will start writing up some of the tools in the beta ribbon soon. Until then feel free to look around at them and if you want to know more about them feel free to contact me.
So with every copy of eVSM v6 we ship two ribbon/toolbar files, in the Program Files\eVSM\Setup\Solutions folder. The main ribbon is stored in the eVSMIconsLGR.xml, and contains the data for building just the main eVSM toolbar.
The second file, when shipped, is called eVSMIconsLGRDev.txt. If you want access to the beta ribbon, just rename that file's extension to XML, and the next time you start eVSM you'll see two new ribbons/toolbars in addition to the main eVSM ribbon. One is the eVSM Beta ribbon, and the other is a Developer Tools ribbon, for anyone who wants to build their own stencils.
I will start writing up some of the tools in the beta ribbon soon. Until then feel free to look around at them and if you want to know more about them feel free to contact me.
eVSM v6.31 Released
eVSM v6.31 was recently released, which includes some updates to several quick stencils, as well as some bug fixes in the software, and a little change to the XY Chart. The XY Chart now allows you to plot as a horizontal bar chart or vertical, with the default being vertical.
Friday, November 1, 2013
eVSM v6.30 Released
Monday, August 19, 2013
Pizza Tracker
Good article about how Domino's pizza tracker works from within the kitchen. Interesting to think about how well the employees might remember to update the trackers, and how you might approach something similar in a manufacture-to-order environment. What about in health care?
http://www.shmula.com/wheres-my-pizza-behind-the-scenes-at-dominos/11659/
http://www.shmula.com/wheres-my-pizza-behind-the-scenes-at-dominos/11659/
Wednesday, June 12, 2013
eVSM Managed Equations - What They Are and How They Work
This is going to be the first of several posts detailing how to use managed equations in eVSM v6. This will mostly apply to v5 as well, but v6 has added a few extra selectors that I will be going over.
Before eVSM v5, any user wishing to calculate variables in a map had to do so themselves. This entailed building a map, then running the Excel calculator to populate a worksheet with all the variables on the map. Then, the user could build equations using Excel's standard equation editing capabilities. If you had to add more activities to a map, you had to re-run the calculator, then either re-apply an equation you already wrote, or write it fresh to work with the new activities.
Around v5.18 (this was before my time with the company) eVSM added what are called Managed Equations. Managed Equations are kind of meta-level equations, specifying how to build Excel formulas, based on what data is available within a map. More specifically, a Managed Equation tells the eVSM calculator engine how to build an equation for a particular variable on a particular IsARow shape.
An IsARow shape is just a shape that gets its own row in Excel. Any IsARow shape needs to have an operation tag glued on in order to go to Excel (except for arrow data, which I'll get to). So when I say IsARow, I mean an activity block or inventory shape or whatever, which has data blocks glued on.
This Managed Equations capability allows the developers of eVSM to produce standardized templates, with predefined variables, that automatically get calculated. So long as you stick to the standard naming convention, eVSM is able to automatically figure out your equations for you.
So, to get into how Managed Equations work, I'm going to introduce a very simple example, below:

Before eVSM v5, any user wishing to calculate variables in a map had to do so themselves. This entailed building a map, then running the Excel calculator to populate a worksheet with all the variables on the map. Then, the user could build equations using Excel's standard equation editing capabilities. If you had to add more activities to a map, you had to re-run the calculator, then either re-apply an equation you already wrote, or write it fresh to work with the new activities.
Around v5.18 (this was before my time with the company) eVSM added what are called Managed Equations. Managed Equations are kind of meta-level equations, specifying how to build Excel formulas, based on what data is available within a map. More specifically, a Managed Equation tells the eVSM calculator engine how to build an equation for a particular variable on a particular IsARow shape.
An IsARow shape is just a shape that gets its own row in Excel. Any IsARow shape needs to have an operation tag glued on in order to go to Excel (except for arrow data, which I'll get to). So when I say IsARow, I mean an activity block or inventory shape or whatever, which has data blocks glued on.
This Managed Equations capability allows the developers of eVSM to produce standardized templates, with predefined variables, that automatically get calculated. So long as you stick to the standard naming convention, eVSM is able to automatically figure out your equations for you.
So, to get into how Managed Equations work, I'm going to introduce a very simple example, below:
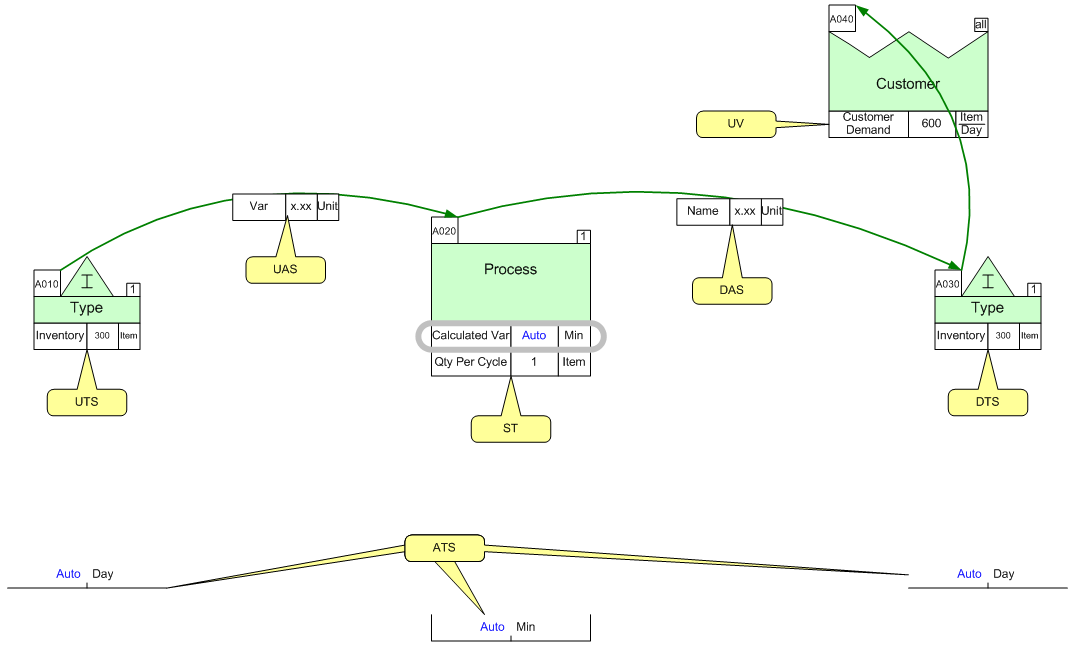
In this example I have a Process box at tag A020, with a variable attached called Calculated Var. There is an inventory block upstream at tag A010, which is connected to tag A020 with a Tag Sequence Arrow. This arrow denotes a flow between A010 and A020. Attached to that arrow is a Short NVU variable, just called Var.
Also, there is an inventory block downstream from the A020 tag, at tag A030. There is a Tag Sequence Arrow denoting flow between A020 and A030, with a Var variable on the arrow as well. Lastly, there is a customer center at tag A040, with a Tag Sequence Arrow connecting tags A030 and A040.
So let's say that we assume that anywhere we have the "Calculated Var" variable, we want to calculate the variable to be the quotient of the Qty Per Cycle for the same activity and the upstream inventory, divided by the product of the Customer Demand and the total Value Added and Non Value Added times for the map.
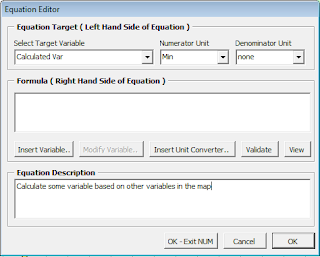
To start off, we'd have to open the eVSM Name and Unit Manager, which is the XYZ button in the toolbar/ribbon, depending on what version of eVSM you're using. You then just click the Equation Manager, and either edit an existing equation or create a new one. Equations are named after the variable that is being calculated, and there can only be one equation per variable name. Also, the variable must be defined before you can create an equation.

So the Equation Editor above shows that I've selected the Calculated Var as the Target Variable. The Target Variable is just the variable name that is getting calculated. eVSM automatically populates the Numerator and Denominator unit for the Target Variable. This is the unit the equation should calculate to. If your equation calculates to Minutes, but you have Hours selected on the actual variable shape, eVSM will automatically convert the unit for you. My point here is, you should only use unit converters explicitly in a managed equation if the default units for different variables don't match up.
So setting up the new equation is pretty simple; you just select the Target Variable, and populate the Right Hand Side of the equation (RHS). The RHS is the actual calculation to take place.
There can be three different components in the RHS: a Variable Selector, a unit converter, or Other text. These components together will be used to build an Excel formula. The Other text pieces get used to build up more complex Excel formulae, unit converters get used to convert terms to the correct units, and Variable Selectors get used to aggregate a set of variable cells into a single number.
The Variable Selectors are the most complex part of a managed equation, so I'll start there, and the Other text and unit converters should start to make sense, too.
A Variable Selector is a text representation for searching for data somehow related to the target variable. Going back to the example above, you might notice a few different possible relationships between the Calculated Var variable and other variables on the map:
- the "Qty Per Cycle" variable is connected to the same IsARow shape as the target variable, and so we call that relationship ST for Same Tag
- the Inventory variable on tag A010 is connected to the target variable, via the Tag Sequence Arrow. Since the A010 tag is on the upstream side of the arrow, the Inventory variable is then considered a UTS variable, for Upstream Tags. One thing to note is, you may have multiple inventory centers upstream from the activity, each with an Inventory variable, and so the UTS selector would return all of those Inventory variables.
- the Inventory variable on tag A030 is connected to the target variable, again via a Tag Sequence Arrow, but this time the Inventory variable is on the downstream side of the arrow. So this relationship, from the perspective of the Target Variable, is DTS, or Downstream Tags. Again, this selector could return multiple Inventory variables.
- the Customer Demand variable is not directly connected to the A020 activity at all. Instead this is sort of a map-wide value, so it shouldn't be considered to be connected to any IsARow shape or variable (it is connected in this map from the A030 tag, but that's more of a visual representation of flow). So the selector to use to grab a variable from anywhere on the page is UV, for Unique Variable.
- The Non Value Added variables on the two inventory tags are technically connected through a UTS and DTS relationship, technically. But, if you wanted to get all the Non Value Added variables for the entire map, you would use the ATS, or All Tags, selector to get those. ATS will just return the set of all Non Value Added variables on the whole map, regardless of tag sequence.
So these are the five most basic selectors available in eVSM. This is already getting really long, so I'll move on and cover the remaining selectors in a future post. These other selectors mainly relate to getting data from the middle of a tag sequence or pipe arrow, or having the target variable reside in the center of a tag sequence or pipe arrow.
Next I want to mention the impact of eVSM Paths on managed equations. The eVSM calculator engine first evaluates the selectors (for instance, you want Non Value Added from All Tags (ATS)). So the calculator engine gets the set of all Non Value Added variables on the map, and for each one looks at whether there is a path match between the target variable's IsARow shape, and the candidate selector variable's IsARow shape. If one of the IsARow shapes is on the All path, then it's just accepted, but if not then we check each path between the IsARow shapes. If no match is found then it is removed from the selector set.
So at this point in the calculation, the selector has returned a set of variables, which need to be aggregated in some way. To aggregate the set to a single number, we can apply one of a number of Excel functions: SUM, AVERAGE, COUNT, MIN, MAX, or PRODUCT. So once the selector returns the set of variables for the term, the calculator engine converts that set to text, as, for example, "SUM(A010 Inventory,A020 Inventory)". Instead of putting in "A010 Inventory", we actually put the Excel address of A010's Inventory variable (so "E5" if A010 is in row 5, and Inventory goes into column E).
So that's for a scenario where the selector returns one or more variables. If a selector returns no variables, then the calculator goes into the Apply/Skip phase. Basically, for each term you have to specify what to do if the selector returns an empty set. You can Skip the equation, which means the calculation engine will not apply any Excel equation, instead just using the current text in the target variable shape. Or, you can elect to apply a default value, which is usually just zero, but can be any number.
So that explains how each term/selector gets evaluated on its own, so I'll now go into how this all works into a managed equation. Rather than start with my ridiculous example, I'll first pull a real-world example from eVSM's Quick Manufacturing template.
The example I'll use is the Activity NVA Per Unit equation, below:
ST(Activity NVA;Min;0;SKIP)/(ST(Qty Per Cycle;Item;1;APPLY)*ST(Stations;Stn;1;APPLY))
I've highlighted the three different selectors in this equation in yellow, and the light blue text is considered Other text.
The equation spreads the Activity NVA value on an IsARow out over the different stations performing the activity, and across multiple parts per activity run.
So let's break down the different selectors, which are all pretty basic:
- ST(Activity NVA;Min;0;SKIP) - This selector is looking for the Activity NVA variable on the same tag as the target variable. It is expecting the value to be in Minutes, and if no Activity NVA variable is found on the same tag, then we skip the equation.
- ST(Qty Per Cycle;Item;1;APPLY) - This selector is looking for a Qty Per Cycle variable on the same tag as the target variable, in units of Item. If the variable is not found, then we just assume a value of 1.
- ST(Stations;Stn;1;APPLY) - This selector is looking for a Stations variable on the same tag as the target variable, in units of Stn. If it's not found, we assume a value of 1.
So when this is being applied to an IsARow with Activity NVA of 5 Min, Qty Per Cycle of 3 Item, and 3 Stations, the resulting equation would have the selectors just replace with cell addresses, and we'd be left with something like: D5/(E5*F5). As you can see by the blue highlighted text in that resulting formula, we literally just put in whatever text we classified as "Other". In this case, it's simply specifying an order of operations with different operators and parentheses.
However, in Quick Manufacturing, we do get a little more complicated with some of the "Other" text, though the logic here is pretty straightforward. As an example, I'll use the Computed Activity Time equation:
if(ST(Activity Time;Hr/Day;0;APPLY)=0,CONV(DAY;Hr),ST(Activity Time;Hr/Day;0;APPLY))
I've used the same color scheme, though I did add the magenta color for the unit converter. But you can see here we're using Excel's IF function, but the meaning may not be immediately straightforward. A different way to read this equation may be:
If the Activity Time on the same tag as the target is zero, use the conversion factor between days and hours, otherwise use the Activity Time variable value. So the conditional portion of the IF function is simply allowing us to use a selector to govern the logic of the calculation. This is just a simple example, but you may see this in use in other built-in equations. The thing to keep in mind is, this is how the developers of the stencils make the calculations smart enough to recognize whether certain variables exist on an IsARow, and kind of a chain of ways to handle the different scenarios.
So now my crazy example from above should be relatively easy to piece together, with knowledge of the different selectors in eVSM. First, I'll write out the equation in relatively plain English:
the quotient of the Qty Per Cycle for the same activity and the upstream inventory, divided by the product of the Customer Demand and the total Value Added and Non Value Added times for the map.
So that to me means we want to have something like:
(ST(Qty Per Cycle)/UTS(Inventory))/(UV(Customer Demand)*((ATS(Value Added)+ATS(Non Value Added)))
In the above, I've simply tried to match text formatting to show the different parts of the equation. This is almost complete; we just need to specify units, aggregation functions, and Skip/Apply options:
(ST(Qty Per Cycle;Item;0;APPLY)/UTS(Inventory;Item;0;APPLY;SUM))/(UV(Customer Demand;Item/Day;0;SKIP)*((ATS(Value Added;Min;0;APPLY;SUM)+(ATS(Non Value Added;Min;0;APPLY;SUM)))
So at first glance, these equations may look very complicated, but the key to understanding them is to break them down into the individual pieces: Selectors, Converters, and Other text. The Other text will give you a clue as to the intention and logic of the equation, and the selectors are just finding data in relation to the variable shape being calculated.
I'll go into the remaining selectors, as well as our calculation debugging efforts, in a future post.
Subscribe to:
Posts (Atom)