I've been at eVSM for three and a half years, and have added a ton of cool functionality to the software.
Hardly anyone realizes this.
For that reason and many others, we've been focusing our attention on delivering a great self-paced learning environment for eVSM v9, which will all be released at the start of 2016. That's assuming everything goes well, anyway.
This new capability will allow us to first deliver great training for our main quick stencils, but over time we'll add more and more advanced tutorials that will expose many of the great tools we've worked on but never fully delivered.
Learn more at our LinkedIn user group:
https://www.linkedin.com/grp/post/3382476-6054686331278290948
Friday, October 2, 2015
Thursday, September 17, 2015
Transactional Demand River
Part of our improvements to the Transactional Pro capability in eVSM included an enhancement to our line thickness visualization gadget. Each green arrow in our transactional map now carries a variable for the demand flowing through it. The gadget uses this data to determine the line thickness.
So, the practical upshot is that it's easy to see how much demand is flowing through a system, even when there rework and splits/merges are involved. When this was shown to an improvement team, they ended up naming this the 'demand river', as it is somewhat akin to water flowing, splitting off, and flowing back together.
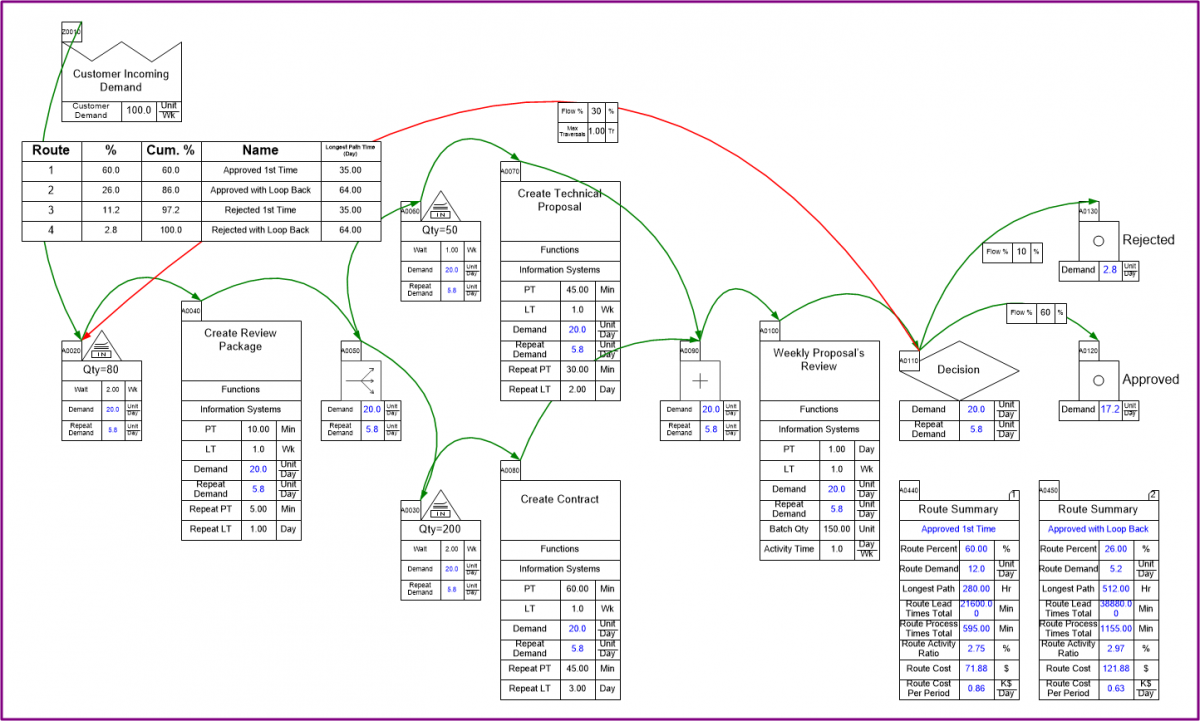
Below is an example future state map for a clinical approval process. The goal of the future state design was to make most of the requests finish with the shortest total lead time possible. We used the demand river to help show the improvement in routings. The big fat lines upstream flow quickly through some decision processes, and split off so that the less-common long-lead items are identified early, and the quick/easy items get approved as quickly as possible.

The underlying data is of course of great interest, but it's absolutely necessary to be able to show it to people visually. Great visualizations like the demand river really help people to understand what the map is showing, which makes it easier for people to reconcile that with the real world. This includes being able to point out mistakes in the map (and in the author's conception of the system) much easier than if you had to try and understand a bunch of data points.
Wednesday, September 16, 2015
Transactional Pro Update
My last post was back in March, and detailed some of the work we did for transactional value stream mapping and analysis. Shortly after that post, we revisited the stencil with some ideas on improving usability and performance.
Long story short, we changed the route table so that you could now have multiple route tables on a single page, and each one could be filtered to show only what you're interested in. For instance, you could easily see just the routes that represent more than X % of the total flow, or cost, in the system.
You can also configure a route table to show only certain variables, and leave out what you don't want, and sort by whatever variable you want.
We also re-factored the software so that you no longer have to re-run the simulation in order to re-draw the route table. You can just add route tables, slice and dice them, iterating quickly, without having to re-run the simulation.
Check out the tutorial for more information, and if needed get a trial download.
Thursday, March 19, 2015
eVSM Quick Transactional Pro
Last year we had a look at our Transactional mapping stencil, and compared its capabilities with example maps from Karen Martin & Mike Osterling's excellent Value Stream Mapping book. We were easilty able to replicate them in eVSM, though we found some of the calculations differed, mainly how lead time is calculated.
Our Quick Manufacturing stencil calculates lead time for inventories based on Little's Law, which is totally reasonable and appropriate for discrete manufacturing. Rather than get into the nuances here, I guess I'll just link Karen's post on the topic because this post is supposed to be about what we did about our findings with the Transactional stencil.
So we looked at everything we did for mapping transactional value streams, and decided the biggest deficiency we had was in handling rework loops. We provided a very basic calculation for rework and left it at that, not even really having it impact lead time, just cost.
In the end we decided to try allowing loops in analyzing transactional value streams. We also had started implementing some calculations for parallel processing in the old Quick Transactional stencil, but wanted to provide full support for it going forward.
What came out of all this work is a new stencil, and a lot of supporting code, called Quick Transactional Pro. The stencil allows you to draw a transactional map with constructs available for multiple rework loops, document splitting and merging, and various termination points. We used constructs from Business Process Modeling Notation (BPMN), specifically: split, merge, and terminate centers.
We tried to make the modeling job as easy as possible, so we end up assuming that the repeat process and lead times are the same as the first-time, but you can add repeat time data when the repeat processing is faster (or slower) than the first time through a process.
Once the map is built you use the Solve tool, which works a bit differently than normal on these types of maps. Rather than perform static Excel calculations, like all our other stencils, we run a three-stage solve. The first stage pre-populates some simple calculations, needed for the second phase. The second phase is a small scale simulation, where we generate some number of 'flow tokens' (250 by default), and send them one-by-one through the value stream. We track the whole route each token takes, and identify every unique route taken. We also count the number of tokens that follow each route.
This flow data is then passed to the third phase of the solve, which uses that flow data first to calculate the First-Time and Repeat demand at every single center in the value stream. This allows us to get a better idea of the actual demand faced by different resources in the value stream, and what capacity is required to serve demand.
The flow data also gets used in the third phase, to give route-specific lead times. We use the flow data to generate what we call a Route Table, which shows all the unique routes identified by the simulation, sorted from highest percentage of flow to the lowest.


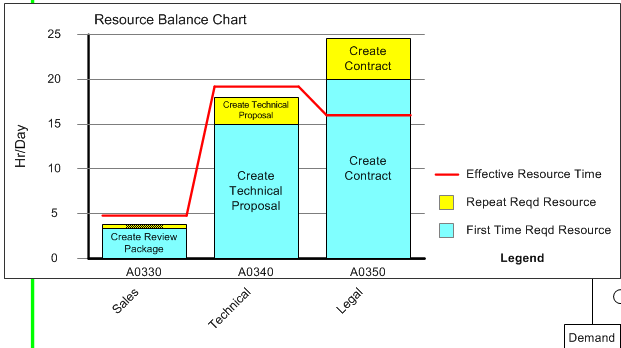
You can also assign resources across processes, and see a balance chart:
Our Quick Manufacturing stencil calculates lead time for inventories based on Little's Law, which is totally reasonable and appropriate for discrete manufacturing. Rather than get into the nuances here, I guess I'll just link Karen's post on the topic because this post is supposed to be about what we did about our findings with the Transactional stencil.
So we looked at everything we did for mapping transactional value streams, and decided the biggest deficiency we had was in handling rework loops. We provided a very basic calculation for rework and left it at that, not even really having it impact lead time, just cost.
In the end we decided to try allowing loops in analyzing transactional value streams. We also had started implementing some calculations for parallel processing in the old Quick Transactional stencil, but wanted to provide full support for it going forward.
What came out of all this work is a new stencil, and a lot of supporting code, called Quick Transactional Pro. The stencil allows you to draw a transactional map with constructs available for multiple rework loops, document splitting and merging, and various termination points. We used constructs from Business Process Modeling Notation (BPMN), specifically: split, merge, and terminate centers.
We tried to make the modeling job as easy as possible, so we end up assuming that the repeat process and lead times are the same as the first-time, but you can add repeat time data when the repeat processing is faster (or slower) than the first time through a process.
Once the map is built you use the Solve tool, which works a bit differently than normal on these types of maps. Rather than perform static Excel calculations, like all our other stencils, we run a three-stage solve. The first stage pre-populates some simple calculations, needed for the second phase. The second phase is a small scale simulation, where we generate some number of 'flow tokens' (250 by default), and send them one-by-one through the value stream. We track the whole route each token takes, and identify every unique route taken. We also count the number of tokens that follow each route.
This flow data is then passed to the third phase of the solve, which uses that flow data first to calculate the First-Time and Repeat demand at every single center in the value stream. This allows us to get a better idea of the actual demand faced by different resources in the value stream, and what capacity is required to serve demand.
The flow data also gets used in the third phase, to give route-specific lead times. We use the flow data to generate what we call a Route Table, which shows all the unique routes identified by the simulation, sorted from highest percentage of flow to the lowest.
The route table is a great way to tell at a glance what are the most common routes through the value stream, and their corresponding lead times. You can also drill down a little further into a single route with the Route Summary, which shows costs associated with a route, the demand, and the Activity Ratio, which is the ratio of Activity Time to Lead Time.
You can right-click on any row and view what activities are part of the route, and you can also see an animated view of the 'token' flowing through. If you want to know your first-pass C&A you would find the route where tokens flow through without rework, and get the flow %.
We also include a few charts, including a lead time ladder chart showing lead components for different routes:
This stencil has been out since last summer, but I've only now gotten around to talking about it. There are a few more exciting new tools in eVSM that I hope to write about sooner.
Quick Transactional Pro is a new way of thinking about mapping transactional value streams, and I can't think of an easier way to see transactional systems when there are loops and parallel processing.
Give eVSM v8 a try now, which includes Quick Transactional Pro. If it's been a while since you've tried eVSM, try it again.
Wednesday, July 2, 2014
eVSM v7 released
We released v7 of eVSM about six months ago, but I haven't posted anything about it here yet. I usually wait until we have a quiet time to go about posting about this stuff, but we've been going pretty fast and heavy on some new functionality, as well as stabilizing migration of older maps. Bad excuse, but there it is.
Anyway, things still aren't quiet here, as we're moving fast on a couple new features, and now we're using secret codenames for projects: Honeyduke, SafetyWeb, and Bertie Bott. All pretty cool functionality that are coming into the product as kind of beta features during v7, and will be finalized in v8 early next year. The code names are coming mostly from Harry Potter, but I think we'll have some Douglas Adams and Lord of the Rings code names too.
v7 is already at its 18th release, so here's a short list of what we've added so far this year:
- New Metric/US units selection - add the Name/Unit data for a map and you now choose what units to use
- Added the Map Copy button back to the ribbon, should be a nice fast way to copy a map to another page
- Added a Stack Help button to help you pick the right icon for a transmit/transport/etc.. shape
- Added Icon Search to help you find a master you want to use. So if you're looking for Changeover, just search that and you'll see what shapes are associated with Changeover.
- Reworked Kaizen/Starburst system, allowing you to pick what data you are interested in, and edit only those fields with bidirectional Excel export/import.
- Revamped the Sketcher Picture Import workflow to make it easier to scale an imported wall map picture
- Added a new MultiAdd quick master type, which basically allows you to assign default addons when you drop say an Activity Center MultiAdd.
- Honeyduke Solve, which is essentially a flow simulation for tokens (work items, patients, whatever might be moving through the value stream). This simulation gives us the ability to calculate demand in the presence of rework loops, document/workflow splits and merges. Very exciting. Use the Quick Transactional Pro stencil to try it out. We might bring this to other stencils but for now it's focused on Office/Healthcare applications.
- Performance has been a big focus in a lot of areas, which is not something most people will probably notice, but my hope is using eVSM will feel smoother and faster going forward, not clunkier and slower.
I wish I could say we have countless other changes, but I can't since I have over 1100 changes logged since the final v6 release. Regardless there are a lot of tweaks, fixes, and improvements and I would encourage you to try, buy, or upgrade to the latest release of eVSM.
We've done a lot of work under the covers, too, to help make the product more reliable. This includes a lot of work on tools to help us manage code development, profiling, and automated testing. I will write a little about this in the future. The next big challenge will be the Bertie Bott project, which I can't elaborate on, but it could be very useful. Possibly more useful than Honeyduke, and Honeyduke is very cool.
Thursday, February 6, 2014
Mailbox App for Demand Leveling
For about a year now, I've been using the Mailbox app on my iPhone and iPad, to manage my work to do list. I know there are a lot of great to do list apps out there (with Trello being my favorite), but the simplest way for me to work is to use my email inbox as my to do list.
I'm usually pretty insistent on maintaining Inbox Zero with my email account, so using it as my to do list also encourages me to get everything I need to get done, done.
But some days I just get slammed with emails from my eVSM colleagues, as well as customer support issues, on top of my usual list of subscription emails. My inbox ends up with a lot more than zero emails in it.
So I have started using the Mailbox app, which is awesome. It will "snooze" an email until a time/day you specify, with a buttery smooth user interface. I actually had a similar system in place that I had put together using Google Apps Script, but it required me to move items into different named folders (like 'wait 1 day', 'wait 1 week', etc...). Mailbox lets me just move something to:
- Later Today (3 hours later, I believe)
- This Evening
- Tomorrow (Morning)
- This Weekend
- Next Week
- Next Month
- Someday (not sure when that is - 3 months?)
- or a specific Date/Time
and at that time, Mailbox will move the email back to my inbox. Until then, it's hidden in a Gmail folder.
So now when my inbox is flooded with emails, I just open the app up and start snoozing emails and clearing the inbox. It's pretty easy to pick these different snooze times so that the emails come back in the order I want to work on them. And sometimes when an email comes back, I snooze it again immediately.
But this app provides a beautifully easy way for me to not only keep my inbox (and my mind) clear of clutter, but also makes it really easy for me to follow up on emails weeks later, when there is zero chance I'd remember to do it myself.
I find myself much more capable at focusing on my work when I only have one or two or three tasks looking at me in my email inbox, rather than trying to constantly re-sort all those emails in my head when I check my email. It would be nice if I could snooze emails from my email client, or even a web app, but I'm fine with using one of my iOS gadgets to do it.
Thursday, January 30, 2014
IFTTT as a Lean Enabling Tool
A few weeks ago we had a bad cold snap in Connecticut, and a few of my pipes froze. The pipes froze not just because of the sub 0F temperatures, but also because I had my wood stove running pretty hard throughout the cold. Because it was so warm in my house from the wood stove, the thermostat in my hall never turned the furnace on, which would have circulated hot water through my baseboard heating system. Instead, the water sat in the pipes and cooled down, and eventually froze.
While I waited for the pipes to thaw, and also while I was repairing one of them, which had burst and started spewing hot water into my basement, I thought about how I could prevent this from happening again.
I could have bought electric heaters for the pipes, which would have been a lot of expense and time buying and installing them. I could also just not run my wood stove, which would mean I'd use more oil than I had been, which would also be pretty expensive.
Instead of spending money on the problem, I decided to try to implement some standard work for handling the cold in my house. I know how silly that sounds, but bear with me. It doesn't get this cold very often in CT (although it has been fairly often this winter), so I knew I'd get careless some night or not pay attention to the forecast, and I'd be back to doing extremely bad pipe soldering jobs (actually, if it happens again I'm going to use PEX).
So I turned to a very cool web-based tool called IFTTT (IF This Then That), which is a service that monitors any of a huge number of different "conditions." The condition can be generated by (currently) around 70 different web services like Facebook, GMail, or Pinboard. When a condition is satisfied (like a new tweet to you, or a new email), you can then have some action run, again against this huge list of web services.
The really cool part of IFTTT is that they have some links into the real world, and not just messaging services. One example is the WeMo switch system, so you can have a lamp turn on when someone sends you an email (who wouldn't want that?). They're also hooked into the weather forecast, which is why I mention the pipes freezing.
So what I ended up doing was, setting up a trigger condition, to send me an email when the forecasted temperature is supposed to be less than 8 degrees Fahrenheit, which is a few degrees above where I've ever had problems with pipes freezing. But I built a list of "tasks" to do when the weather is going to be cold, basically:
- Make sure my basement has good airflow, so my cedar closet gets good air flow (that's where the burst happened)
- Make sure I turn the thermostat on before I go to sleep, to warm the pipes
- Lay off the wood stove a little bit, so the thermostat is able to come on through the night
Now, I don't have to spend any mental effort on what the weather is like, I just let the IFTTT service keep an eye on things and tell me only on days when I have to worry about it. I actually set the alert up to send me an alert when the forecast is for less than 8 degrees, and then again when the temperature actually dips that low.
And really, I feel like the optimal set up for me would be to have something like the Nest thermostat, but have it controlled via the IFTTT service or something similar. I'd like it to go into a different mode when the temperature outside my house drops, and no matter what the temperature in the house, just circulate the water in the pipes every hour or two. If only there was an IFTTT trigger for when Nest integrates with IFTTT. And I just looked, and they actually have a trigger for new channels. Crazy.
So after all that, my point is, you should have a look at IFTTT.com, and think about whether there is some trigger you could use to alert you so you don't miss something. Or maybe set up a trigger so when your most important client sends you a message, that lamp does turn on. Why not? How much is it worth to make them happy? Also, that WeMo system has a motion detector, so you could set IFTTT up to text you when someone trips that motion sensor.
I've actually thought about this topic quite a lot over the last few years, after noticing that a lot of the reason that organizations struggle with change because they let processes stagnate for years regardless of changes in conditions. So I've always wanted a tool that would let me input the conditions that affected some business decision, and once those conditions change, they tell me to re-evaluate the conditions and update my processes. That's what's exciting about IFTTT, because as they add more and more of these trigger channels, the tool I want so badly gets closer and closer to fruition.
So that's why I say IFTTT is a lean-enabling tool. It lets you focus on other things, but makes sure you don't miss out on something important.
Subscribe to:
Posts (Atom)