Monday, December 30, 2013

eVSM Managed Equations - Part 2 (and the Calculation Explorer)

OK so in part 1 of this post, I talked about what eVSM managed equations are and how the basic ones work.  In this post, I'd like to briefly go over the arrow-based selectors for managed equations, but in all honesty they are probably beyond the scope of what most of our users will want to do with them.

So I'll start with a very busy image showing a few things of real interest:

The first thing I want to point out is the "Calculation Explorer" dialog.  This dialog actually has shipped with, I think, every release of v6, at least those with the Beta Toolbar.  The calculation explorer actually resides within the Developer ribbon, so definitely be careful in there.  But getting the developer ribbon is done the same as getting the Beta Toolbar, so go read that if you need to get that working.

The Calculation Explorer is a neat utility.  What it does is, first adds a simple unstyled text box onto the page for each hidden variable on the map, and then it runs through a partial Solve cycle, just enough to pick up the dependency tree of the map.  Excel provides similar buttons, for exploring the dependency tree of a worksheet.

Anyway, this dialog exists for the sole purpose of visualizing the relationships between variables on the map.  It is very useful in debugging calculations, especially since it prints out messages from the Solve engine, explaining some of the decisions it has made about linking different variables on the map.


Now, the reason the Calculation Explorer is in a post about managed equations is that we display a simplified view of the managed equation for the selected variable.  This, combined with the Solve trace output, can tell us much about how a managed equation got applied (or skipped).

In the image above, you can see I've selected the Resource Usage NVU on the Pipe Arrow between tags A0030 and A0040.  Actually you can't see the selection in the image, but just look at where the second text block in the top center of the Visio window.  When I selected that text block, the dialog displayed the equation, which is 'SP[Resource PT] * DPC[Computed Demand]', and when I clicked the "Show Precedents" button, it drew arrows to the corresponding NVU's.  So you'll see that the Resource PT NVU that is being pointed to is on the Same Pipe, which is what SP stands for.  You'll also see that the Computed Demand variable is on the activity Downstream from the Pipe, at the end of the Connection, hence DPC - Downstream Pipe Connect.  So this selects an NVU from the center on the head end of Pipe Arrow.  UPC selects from the center at the tail of the arrow.  UC and DC work the exact same way, except that they apply to Tag Sequence arrows rather than Pipes.

The SP, or Same Pipe, has an analog in the SA selector, which is Same Arrow, and applies to Tag Sequence arrows.


This image doesn't show real equations in Quick Mfg like the first image does, but it does illustrate the remaining selectors.  The UPTS/DPTS selectors let you get a variable from a center on the other end of a pipe arrow (or sequence arrow, using UTS/DTS).  UPS/DPS let you select a variable from the pipe arrow data set, and UAS/DAS let you do the same with Tag Sequence arrows.

There is no denying that these selectors can be a bit confusing.  The good thing is our stencil designers understand this very well and most of our users just get to use the centers and not worry about it.  If you want to build your own managed equations, I hope these two posts might help you better to understand how to go about doing that.  Or, if you're just curious how we build our calculations, this should show you. I do encourage you to explore a map you have at some point, using that Calculation Explorer utility.


Monday, December 23, 2013

Source / Target for sub-modelling

Since eVSM v6.15 or so, we've had a fairly powerful (and I hope, simple to understand) capability called Source/Target.  What it does, simply, is allow you to use the value of a variable in one map, as the value of a variable on another page in the same Visio document.

There is some initial setup required, which tells eVSM to search other pages for source/target links when you click the eVSM Calculator button.  We call this the page scope of the map.  To set up page scope, click the Name Unit Manager button in the eVSM toolbar/ribbon, and find the "Source/Target Pages" button on the bottom of the NUM dialog box.

The dialog just lists all the pages in the current document, and selecting a page will make the eVSM Calculator search the page for data sources and targets to match up.


So with that out of the way, Source/Target works by first defining named data sources.  The pink shape in the image above is a data source, which you just glue onto an NVU to link to the value.  You then change the text from XX to whatever name you want to give it (can be a number, or any kind of text).

Then, to use the value from a data source, you attach the light blue data target to another NVU, and set its text to the same as your data source.

You can actually have many data sources with the same name, though that means your data target(s) will need to know how to "aggregate" the multiple values.  By default, we just return the Sum of all the values.  But you can actually take the average, minimum, or maximum value too.

There's also an undocumented feature here, that lets you use simple wild cards to match sources to a target.  So if you named all your different sources such that any starting with the letter A is a certain group, and B is another, etc..., you'd be able to set the target text to A* and that would pick up anything starting with the letter A.

There's also a not-so undocumented feature, which is that every NVU on the map has an implied Data Source, with the text set to the NVU name.  That means if you wanted to get the sum of all the NVU's with a certain name, you could just add a data target and set its text to the NVU name.  This helps you out of having to write very simple managed equations.

We also provide the option of filtering by the path(s) of the parent center, and we provide a dialog for exploring all the sources that feed a target.  That dialog actually does link to the dialog for setting the page link scope.

If you have any questions on this leave a comment or contact me, I'm happy to discuss...

Friday, December 6, 2013

eVSM v6.33 Released

We've just put out a v6.33 release, which fixes a very embarrassing bug I let slip through into the v6.32 release, which basically didn't allow you to use tag sequence or pipe arrows with data.

I have been trying to increase the coverage on our automated tests lately but I guess I never got this particular issue tested, until now.

Do upgrade if you installed 6.32, with my apologies.

Wednesday, November 27, 2013

eVSM v6.32 released

We've just released a new update to eVSM, v6.32, which has the following enhancements:

  • A new Food Network Wizard for modeling end-to-end food manufacturing and distribution
  • Fixed 5 major bugs, and several minor ones
  • Improved NVU hide/show performance substantially (should be at least 2x faster)
  • Optimized some low-level functions for speed, should make most of the product feel a little zippier.
  • Added many-to-one and one-to-many Auto Sequence buttons, to allow you to select a single center as an originating center, and multiple destination centers (or vice versa) and add tag sequence arrows.  Also added the same tools, but for pipe arrows.
  • Added smarter units converter detection, so that if you don't add a quick time center we add whatever units are missing and make you fill them out before we allow solve to run.
  • Now applying hide/show settings when you drop shapes out from a quick stencil.
  • Added a new dialog for controlling hide/show of variable names, which only shows the variables currently on the map, in alphabetic order.  This is currently only available in the Beta Tab.
  • Added double-click to edit a variable in the List Variables dialog.  This dialog was new in like v6.31 I think, and basically it's like Visio's Custom Properties window, so you leave the dialog open and when you select a center we show you all the data on that center, hidden and visible.  Now you can double click a variable to edit it.
  • Added beta tools for standardizing properties on all kaizen shapes on a page, as well as 2-way Excel import/export of kaizen data.  This is barely out of alpha testing, so be cautious in using it and know that there's a possibility of losing your data if you use it.

Thursday, November 21, 2013

Sketcher Image Import

OK so I last talked about the eVSM Beta Ribbon, so I'm going to talk about one of the beta tools we've had sitting around for about 8 months: Sketcher Image Import

First, a quick description of the Sketcher, since I haven't written about it.  We created the eVSM Sketch module to help people translate a map from pencil/paper to an eVSM map as quickly and painlessly as possible.  The idea is, you "sketch" a VSM using simple VSM shapes, either directly on a picture of the wall map, or while looking at a wall map.  Then, you right-click one of the VSM shapes and add data to the map, and we add in all the data blocks for your selected stencil.

Example Sketcher map

So one thing we've run into during training on the Sketcher, is it takes a bit of effort to import these pictures and scale them and position them and make sure the image doesn't get in the way of drawing.  It's a pain, because most casual eVSM users don't know how to do all this within Visio.

So, I created a tool to help alleviate this pain.  You select your image file, then you get a preview of the image.
Sketcher Image Import dialog

From there, you pick two points on the image, to help establish scale.  So for a post it map I would click on the top left corner of a post-it, then the top right corner, and type '1.5' into the scale text box.  This tells the tool that however many pixels makes up the width of a post-it in this picture should equate to 1.5" on the VSM page.  A post-it is actually 3"x3", but in eVMS our shapes are usually 1.5" wide. 

Then, you just click the 'Load to Map' button, and we import the image to Visio, and put it on a locked, semi-transparent layer on your page.

Completed Sketch

After that, you can start dropping out our Sketcher shapes on top of the picture, copy text over, and maybe even add your data blocks.

Auto-adding data

So copying data from the image can be pretty tricky, usually because it's hard to read handwriting when the pictures are usually taken from somewhat far away.  Also the transparency doesn't help, but turning off the Visio grid can help.  But we usually will just go post-it by post-it, and enter data.

After your sketch is complete, you can complete the transformation to a regular map, by using the Sketcher Align tool, which is also currently only in the Beta toolbar.  This tool tries to recognize the spatial relationships between all the Sketcher shapes on the page, and lay the map out for you as you would if you had just used our quick stencils.

Aligned map

The Sketcher Align tool used to be in the main toolbar, but during our training sessions users really really hated it, but I think we've improved it since then.  Once we got Undo to work with it, I think it became a little more popular, since it's not always great at aligning things.  One thing to note here is, I actually copied the Sketch onto a new page, without the post-it picture as a background.

Thursday, November 14, 2013

eVSM Beta Toolbar

One thing we haven't previously made public (that I'm aware of), is a beta toolbar/ribbon in eVSM v6.  This is where we keep some tools/features we're working on that aren't quite done yet.  Sometimes they are done, and we don't believe them to be mainstream enough to warrant taking up space in the main eVSM ribbon/toolbar.

So with every copy of eVSM v6 we ship two ribbon/toolbar files, in the Program Files\eVSM\Setup\Solutions folder.  The main ribbon is stored in the eVSMIconsLGR.xml, and contains the data for building just the main eVSM toolbar.

The second file, when shipped, is called eVSMIconsLGRDev.txt.  If you want access to the beta ribbon, just rename that file's extension to XML, and the next time you start eVSM you'll see two new ribbons/toolbars in addition to the main eVSM ribbon.  One is the eVSM Beta ribbon, and the other is a Developer Tools ribbon, for anyone who wants to build their own stencils.

I will start writing up some of the tools in the beta ribbon soon.  Until then feel free to look around at them and if you want to know more about them feel free to contact me.

eVSM v6.31 Released

eVSM v6.31 was recently released, which includes some updates to several quick stencils, as well as some bug fixes in the software, and a little change to the XY Chart.  The XY Chart now allows you to plot as a horizontal bar chart or vertical, with the default being vertical.

Friday, November 1, 2013

eVSM v6.30 Released

We've just finished up version 6.30 of eVSM, which has hundreds of changes and bug fixes.  The Quick Manufacturing stencil now includes Yamazumi charting for resource usage.  All in all a worthy update to v6, or upgrade if you have an older license.

Monday, August 19, 2013

Pizza Tracker

Good article about how Domino's pizza tracker works from within the kitchen.  Interesting to think about how well the employees might remember to update the trackers, and how you might approach something similar in a manufacture-to-order environment.  What about in health care?

http://www.shmula.com/wheres-my-pizza-behind-the-scenes-at-dominos/11659/

Wednesday, June 12, 2013

eVSM Managed Equations - What They Are and How They Work

This is going to be the first of several posts detailing how to use managed equations in eVSM v6.  This will mostly apply to v5 as well, but v6 has added a few extra selectors that I will be going over.

Before eVSM v5, any user wishing to calculate variables in a map had to do so themselves.  This entailed building a map, then running the Excel calculator to populate a worksheet with all the variables on the map.  Then, the user could build equations using Excel's standard equation editing capabilities.  If you had to add more activities to a map, you had to re-run the calculator, then either re-apply an equation you already wrote, or write it fresh to work with the new activities.

Around v5.18 (this was before my time with the company) eVSM added what are called Managed Equations.  Managed Equations are kind of meta-level equations, specifying how to build Excel formulas, based on what data is available within a map.  More specifically, a Managed Equation tells the eVSM calculator engine how to build an equation for a particular variable on a particular IsARow shape.

An IsARow shape is just a shape that gets its own row in Excel.  Any IsARow shape needs to have an operation tag glued on in order to go to Excel (except for arrow data, which I'll get to).  So when I say IsARow, I mean an activity block or inventory shape or whatever, which has data blocks glued on.

This Managed Equations capability allows the developers of eVSM to produce standardized templates, with predefined variables, that automatically get calculated.  So long as you stick to the standard naming convention, eVSM is able to automatically figure out your equations for you.

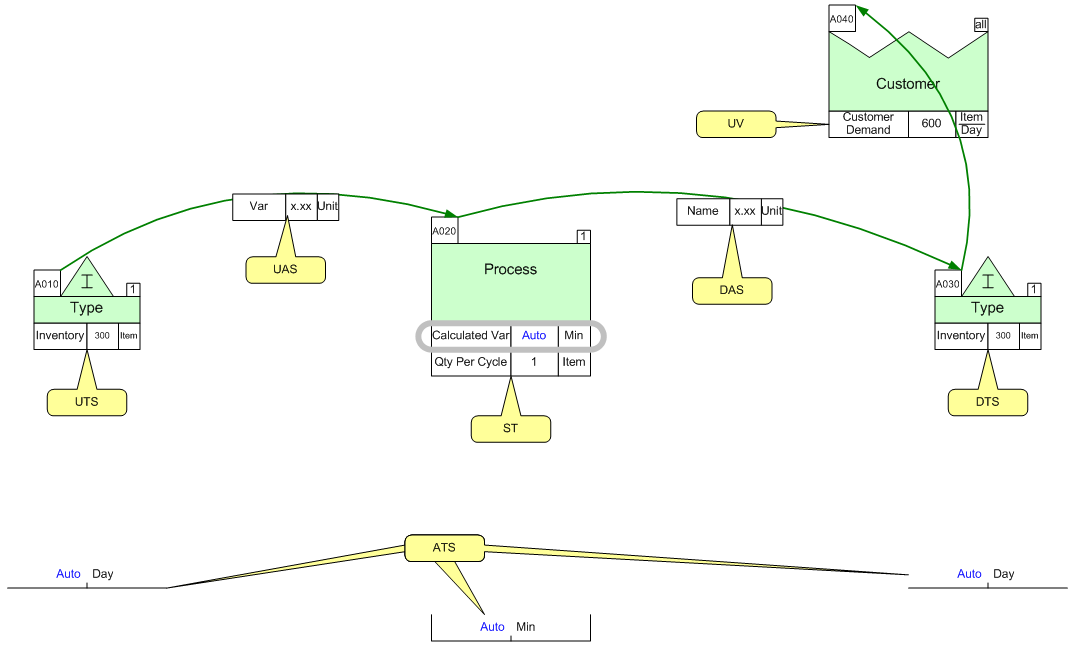
So, to get into how Managed Equations work, I'm going to introduce a very simple example, below:


In this example I have a Process box at tag A020, with a variable attached called Calculated Var.  There is an inventory block upstream at tag A010, which is connected to tag A020 with a Tag Sequence Arrow.  This arrow denotes a flow between A010 and A020.  Attached to that arrow is a Short NVU variable, just called Var.

Also, there is an inventory block downstream from the A020 tag, at tag A030.  There is a Tag Sequence Arrow denoting flow between A020 and A030, with a Var variable on the arrow as well.  Lastly, there is a customer center at tag A040, with a Tag Sequence Arrow connecting tags A030 and A040.

So let's say that we assume that anywhere we have the "Calculated Var" variable, we want to calculate the variable to be the quotient of the Qty Per Cycle for the same activity and the upstream inventory, divided by the product of the Customer Demand and the total Value Added and Non Value Added times for the map.

To start off, we'd have to open the eVSM Name and Unit Manager, which is the XYZ button in the toolbar/ribbon, depending on what version of eVSM you're using.  You then just click the Equation Manager, and either edit an existing equation or create a new one.  Equations are named after the variable that is being calculated, and there can only be one equation per variable name.  Also, the variable must be defined before you can create an equation.


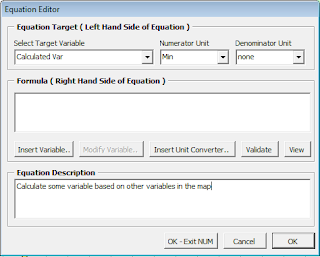
So the Equation Editor above shows that I've selected the Calculated Var as the Target Variable.  The Target Variable is just the variable name that is getting calculated.  eVSM automatically populates the Numerator and Denominator unit for the Target Variable.  This is the unit the equation should calculate to.  If your equation calculates to Minutes, but you have Hours selected on the actual variable shape, eVSM will automatically convert the unit for you.  My point here is, you should only use unit converters explicitly in a managed equation if the default units for different variables don't match up.

So setting up the new equation is pretty simple; you just select the Target Variable, and populate the Right Hand Side of the equation (RHS).  The RHS is the actual calculation to take place.

There can be three different components in the RHS: a Variable Selector, a unit converter, or Other text.  These components together will be used to build an Excel formula.  The Other text pieces get used to build up more complex Excel formulae, unit converters get used to convert terms to the correct units, and Variable Selectors get used to aggregate a set of variable cells into a single number.

The Variable Selectors are the most complex part of a managed equation, so I'll start there, and the Other text and unit converters should start to make sense, too.

A Variable Selector is a text representation for searching for data somehow related to the target variable.  Going back to the example above, you might notice a few different possible relationships between the Calculated Var variable and other variables on the map:
  • the "Qty Per Cycle" variable is connected to the same IsARow shape as the target variable, and so we call that relationship ST for Same Tag
  • the Inventory variable on tag A010 is connected to the target variable, via the Tag Sequence Arrow.  Since the A010 tag is on the upstream side of the arrow, the Inventory variable is then considered a UTS variable, for Upstream Tags.  One thing to note is, you may have multiple inventory centers upstream from the activity, each with an Inventory variable, and so the UTS selector would return all of those Inventory variables.
  • the Inventory variable on tag A030 is connected to the target variable, again via a Tag Sequence Arrow, but this time the Inventory variable is on the downstream side of the arrow.  So this relationship, from the perspective of the Target Variable, is DTS, or Downstream Tags.  Again, this selector could return multiple Inventory variables.
  • the Customer Demand variable is not directly connected to the A020 activity at all.  Instead this is sort of a map-wide value, so it shouldn't be considered to be connected to any IsARow shape or variable (it is connected in this map from the A030 tag, but that's more of a visual representation of flow).  So the selector to use to grab a variable from anywhere on the page is UV, for Unique Variable.
  • The Non Value Added variables on the two inventory tags are technically connected through a UTS and DTS relationship, technically.  But, if you wanted to get all the Non Value Added variables for the entire map, you would use the ATS, or All Tags, selector to get those.  ATS will just return the set of all Non Value Added variables on the whole map, regardless of tag sequence.
So these are the five most basic selectors available in eVSM.  This is already getting really long, so I'll move on and cover the remaining selectors in a future post.  These other selectors mainly relate to getting data from the middle of a tag sequence or pipe arrow, or having the target variable reside in the center of a tag sequence or pipe arrow.

Next I want to mention the impact of eVSM Paths on managed equations.  The eVSM calculator engine first evaluates the selectors (for instance, you want Non Value Added from All Tags (ATS)).  So the calculator engine gets the set of all Non Value Added variables on the map, and for each one looks at whether there is a path match between the target variable's IsARow shape, and the candidate selector variable's IsARow shape.  If one of the IsARow shapes is on the All path, then it's just accepted, but if not then we check each path between the IsARow shapes.  If no match is found then it is removed from the selector set.

So at this point in the calculation, the selector has returned a set of variables, which need to be aggregated in some way.  To aggregate the set to a single number, we can apply one of a number of Excel functions: SUM, AVERAGE, COUNT, MIN, MAX, or PRODUCT.  So once the selector returns the set of variables for the term, the calculator engine converts that set to text, as, for example, "SUM(A010 Inventory,A020 Inventory)".  Instead of putting in "A010 Inventory", we actually put the Excel address of A010's Inventory variable (so "E5" if A010 is in row 5, and Inventory goes into column E).

So that's for a scenario where the selector returns one or more variables.  If a selector returns no variables, then the calculator goes into the Apply/Skip phase.  Basically, for each term you have to specify what to do if the selector returns an empty set.  You can Skip the equation, which means the calculation engine will not apply any Excel equation, instead just using the current text in the target variable shape.  Or, you can elect to apply a default value, which is usually just zero, but can be any number.

So that explains how each term/selector gets evaluated on its own, so I'll now go into how this all works into a managed equation.  Rather than start with my ridiculous example, I'll first pull a real-world example from eVSM's Quick Manufacturing template.

The example I'll use is the Activity NVA Per Unit equation, below:

    ST(Activity NVA;Min;0;SKIP)/(ST(Qty Per Cycle;Item;1;APPLY)*ST(Stations;Stn;1;APPLY))

I've highlighted the three different selectors in this equation in yellow, and the light blue text is considered Other text.

The equation spreads the Activity NVA value on an IsARow out over the different stations performing the activity, and across multiple parts per activity run.

So let's break down the different selectors, which are all pretty basic:
  • ST(Activity NVA;Min;0;SKIP) - This selector is looking for the Activity NVA variable on the same tag as the target variable.  It is expecting the value to be in Minutes, and if no Activity NVA variable is found on the same tag, then we skip the equation.
  • ST(Qty Per Cycle;Item;1;APPLY) - This selector is looking for a Qty Per Cycle variable on the same tag as the target variable, in units of Item.  If the variable is not found, then we just assume a value of 1.
  • ST(Stations;Stn;1;APPLY) - This selector is looking for a Stations variable on the same tag as the target variable, in units of Stn.  If it's not found, we assume a value of 1.
So when this is being applied to an IsARow with Activity NVA of 5 Min, Qty Per Cycle of 3 Item, and 3 Stations, the resulting equation would have the selectors just replace with cell addresses, and we'd be left with something like: D5/(E5*F5). As you can see by the blue highlighted text in that resulting formula, we literally just put in whatever text we classified as "Other".  In this case, it's simply specifying an order of operations with different operators and parentheses.

However, in Quick Manufacturing, we do get a little more complicated with some of the "Other" text, though the logic here is pretty straightforward.  As an example, I'll use the Computed Activity Time equation:
     if(ST(Activity Time;Hr/Day;0;APPLY)=0,CONV(DAY;Hr),ST(Activity Time;Hr/Day;0;APPLY))

I've used the same color scheme, though I did add the magenta color for the unit converter.  But you can see here we're using Excel's IF function, but the meaning may not be immediately straightforward.  A different way to read this equation may be:
If the Activity Time on the same tag as the target is zero, use the conversion factor between days and hours, otherwise use the Activity Time variable value.  So the conditional portion of the IF function is simply allowing us to use a selector to govern the logic of the calculation.  This is just a simple example, but you may see this in use in other built-in equations.  The thing to keep in mind is, this is how the developers of the stencils make the calculations smart enough to recognize whether certain variables exist on an IsARow, and kind of a chain of ways to handle the different scenarios.

So now my crazy example from above should be relatively easy to piece together, with knowledge of the different selectors in eVSM.  First, I'll write out the equation in relatively plain English:
     the quotient of the Qty Per Cycle for the same activity and the upstream inventory, divided by the product of the Customer Demand and the total Value Added and Non Value Added times for the map.

So that to me means we want to have something like:
     (ST(Qty Per Cycle)/UTS(Inventory))/(UV(Customer Demand)*((ATS(Value Added)+ATS(Non Value Added)))

In the above, I've simply tried to match text formatting to show the different parts of the equation.  This is almost complete; we just need to specify units, aggregation functions, and Skip/Apply options:
     (ST(Qty Per Cycle;Item;0;APPLY)/UTS(Inventory;Item;0;APPLY;SUM))/(UV(Customer Demand;Item/Day;0;SKIP)*((ATS(Value Added;Min;0;APPLY;SUM)+(ATS(Non Value Added;Min;0;APPLY;SUM)))

So at first glance, these equations may look very complicated, but the key to understanding them is to break them down into the individual pieces: Selectors, Converters, and Other text.  The Other text will give you a clue as to the intention and logic of the equation, and the selectors are just finding data in relation to the variable shape being calculated.

I'll go into the remaining selectors, as well as our calculation debugging efforts, in a future post.

Thursday, April 4, 2013

More on the new eVSM Calculator Engine

In my last post I talked about the new eVSM Calculator engine.  I mentioned how this new more flexible engine allowed us to do some cool new things, and I'd like to go over some of those cool things here.

The first new tool is the Source/Target capability in v6 (I think available after 6.15 or so).  Source/Target is simple enough in principle, in that it simply enables you to link a variable shape to one or more other variable shapes.  This actually works between pages in a single Visio document, so you can cross-link from one map to another.

Here are the shapes you use:
The pink shape is a Data Source, and is basically a named variable on the map.  You just specify a short alphanumeric name for the source, and then you add one of those blue shapes, called a Data Target.  You just make the link by making the target name the same as the source name.

You can actually have multiple data sources with the same name, and if you look closely at the target shape it says "SUM".  This is the default way the target handles multiple data sources: it sums their values.  If you right click the target shape you can change it to take the average, max, or min value of the sources available with that name.

You can also make the target path-based, meaning it only uses sources that are on centers with the same path number.  There's also a new (in v6.20) option when you right click a target shape for viewing the sources that the target will use.

One important note here is that by default, the calculator engine will only search the current map, for data sources and targets.  If you want to link to another page, you have to set the "Page Scope", so that the calculator engine knows what pages to search.  We do this because we actually calculate each page in the scope, in order to make sure the values we use are current.  We also do this because if you copy a map to build a future state map, your source and target names would stay the same, and so we'd actually start using a lot of data we shouldn't.

To modify the Page Scope, click the Name Unit Manager button in the eVSM Toolbar/Ribbon, and click "Page Link Scope" near the bottom.  You'll then see a list of all the pages in the current document, except for the current page.  We don't list the current page since it's included in the page scope by default.

Now, here are some advanced tips for using source/target:

  • Every variable shape on the map actually has a "hidden" Data Source shape on it, with the variable name as the text.  So if you wanted to simply put the sum of all Cycle Time variables in the Lead Time variable, you would just add a Data Target to the lead time and set its text to Cycle Time, and that's it!
  • The source/target engine uses text matching to find matches, so not only are they case-insensitive, you can use simple wildcards to make the target a bit more flexible.  For instance, if you had three sources, S1, S2, and S3, you could get the Sum of all three by setting your Data Target text to "S*".  The * character tells us to just look for the letter S followed by anything.  You could also do "S#", which would only match the letter S followed by a single number.
Source/Target gives eVSM users a powerful method for linking between maps, especially with our new Wizards we are creating (I'll talk about those in the future).  If you're curious, you can actually see that the way this works is very simple.  We are just linking cells in the eVSM document's Excel workbook, the same that you could do manually.  This is just a way for you to tell eVSM to make those links.

Friday, March 8, 2013

New Developments with eVSM

I just realized I've been working on eVSM for almost a year, and haven't really talked about any of the changes we've made in that time.  Part of the reason for that is I've not wanted to talk about new upcoming features until they were released and well documented.

I now realize many features have been in use for at least three months, if not longer.

The first I'd like to talk about is one of the flagship functions of eVSM, the eVSM Calculator.  This tool has been around since early versions of eVSM, and has grown new features over the whole time of its existence.  What used to be a simple function for exporting shape data fields to Excel and pulling user equations back in from Excel has grown into a powerful tool that writes the equations for you.

The complexity of the code behind the calculator grew quite a lot, since the original base code was never really designed to handle some of the functionality it grew to support.  This ultimately ended up in long run times for calculating a map.  While probably good for the coffee, water bubbler, and gossip industries, we realized the calculator was getting too slow.

So we rewrote the tool from scratch.  Which is usually a bad idea.  But in our case, we sort of treated the old calculator as a 10 year old prototype that happened to work wonderfully in production.

The old calculator used VBA collections to hold a lot of the data from the map in memory, which made things really hard to debug.  I did modify the collection code to also store the keys for the collection within the collection, so I could at least see what data was where.  But in the end I ended up designing a simple object model using VBA Classes, which provides us an "early binding" of many of the properties we want to know about our eVSM shapes (tag ID, paths present, variables present).

The overall hierarchy we have now is a Map class at the top level, which holds all the data for a single Visio page.  Each map has a list of all the "Row" centers, which are individual process (or other type) blocks, which we store as a Tag object.  The Tag object keeps a pointer to the center shape, the tag shape, and holds a list of Paths and Data.  The Data collection is a list of NVU objects.

By putting all the page data into this object model, we found we could read the Visio page one time, and keep all the data we wanted in memory, in very convenient and (relatively) efficient objects.  The other big performance gain came from using batch array techniques to talk to the Excel application object as few times as possible.  We found we could make our VBA code as inefficient as we wanted, as long as we minimized the number of calls to Excel and Visio's application objects.

Overall we found we were getting at least 5x speed improvements, while maintaining the functionality of the tool.  We did have to find and fix many bugs, most of which were probably encountered the first time writing the old calculator.  But I'm happy we ended up rewriting from scratch, as this new object model has enabled us to do some great things, which I'll have to put in other posts.

Thursday, February 14, 2013

Server Load Balancing Simulation

I read an interesting (to me) post about scaling a web application using the Heroku stack, and how they ended up having capacity issues not from the servers, but from the load balancing router.

Heroku recently changed the router from selecting the next available server to just selecting a server from the pool randomly and passing it without blocking.  Each server has its own blocking queue, in this case.  The justification from Heroku was that for a non-blocking server (like Node.js) this wouldn't be an issue, and should improve utilization.

But, the folks at RapGenius use Ruby on Rails, which is a blocking server, meaning they can process just one request at a time.

So I was reading the article, and they were complaining that they now needed to increase the number of servers, in order to meet the demand on their website.  I was starting to get antsy when they seemed to be speculating, but then they showed results from a simulation they ran in R, and that made me really happy.  Especially since they were able to put together statistics for their request processing times and identify a distribution.

I can't help but think how easy this model would be to build, run, and analyze in any of the available discrete event simulation tools we use, rather than use R.  But, R is free to use and our favorite discrete event simulators are not so much.  But, I wonder how many of these startups would ever consider using something like Simio to model their website infrastructure, and ultimately help themselves scale up.

Here's the post.