- A new Food Network Wizard for modeling end-to-end food manufacturing and distribution
- Fixed 5 major bugs, and several minor ones
- Improved NVU hide/show performance substantially (should be at least 2x faster)
- Optimized some low-level functions for speed, should make most of the product feel a little zippier.
- Added many-to-one and one-to-many Auto Sequence buttons, to allow you to select a single center as an originating center, and multiple destination centers (or vice versa) and add tag sequence arrows. Also added the same tools, but for pipe arrows.
- Added smarter units converter detection, so that if you don't add a quick time center we add whatever units are missing and make you fill them out before we allow solve to run.
- Now applying hide/show settings when you drop shapes out from a quick stencil.
- Added a new dialog for controlling hide/show of variable names, which only shows the variables currently on the map, in alphabetic order. This is currently only available in the Beta Tab.
- Added double-click to edit a variable in the List Variables dialog. This dialog was new in like v6.31 I think, and basically it's like Visio's Custom Properties window, so you leave the dialog open and when you select a center we show you all the data on that center, hidden and visible. Now you can double click a variable to edit it.
- Added beta tools for standardizing properties on all kaizen shapes on a page, as well as 2-way Excel import/export of kaizen data. This is barely out of alpha testing, so be cautious in using it and know that there's a possibility of losing your data if you use it.
Wednesday, November 27, 2013
eVSM v6.32 released
We've just released a new update to eVSM, v6.32, which has the following enhancements:
Thursday, November 21, 2013
Sketcher Image Import
OK so I last talked about the eVSM Beta Ribbon, so I'm going to talk about one of the beta tools we've had sitting around for about 8 months: Sketcher Image Import
First, a quick description of the Sketcher, since I haven't written about it. We created the eVSM Sketch module to help people translate a map from pencil/paper to an eVSM map as quickly and painlessly as possible. The idea is, you "sketch" a VSM using simple VSM shapes, either directly on a picture of the wall map, or while looking at a wall map. Then, you right-click one of the VSM shapes and add data to the map, and we add in all the data blocks for your selected stencil.

So one thing we've run into during training on the Sketcher, is it takes a bit of effort to import these pictures and scale them and position them and make sure the image doesn't get in the way of drawing. It's a pain, because most casual eVSM users don't know how to do all this within Visio.
So, I created a tool to help alleviate this pain. You select your image file, then you get a preview of the image.


First, a quick description of the Sketcher, since I haven't written about it. We created the eVSM Sketch module to help people translate a map from pencil/paper to an eVSM map as quickly and painlessly as possible. The idea is, you "sketch" a VSM using simple VSM shapes, either directly on a picture of the wall map, or while looking at a wall map. Then, you right-click one of the VSM shapes and add data to the map, and we add in all the data blocks for your selected stencil.
Example Sketcher map
So one thing we've run into during training on the Sketcher, is it takes a bit of effort to import these pictures and scale them and position them and make sure the image doesn't get in the way of drawing. It's a pain, because most casual eVSM users don't know how to do all this within Visio.
So, I created a tool to help alleviate this pain. You select your image file, then you get a preview of the image.

Sketcher Image Import dialog
From there, you pick two points on the image, to help establish scale. So for a post it map I would click on the top left corner of a post-it, then the top right corner, and type '1.5' into the scale text box. This tells the tool that however many pixels makes up the width of a post-it in this picture should equate to 1.5" on the VSM page. A post-it is actually 3"x3", but in eVMS our shapes are usually 1.5" wide.
Then, you just click the 'Load to Map' button, and we import the image to Visio, and put it on a locked, semi-transparent layer on your page.

Completed Sketch
After that, you can start dropping out our Sketcher shapes on top of the picture, copy text over, and maybe even add your data blocks.
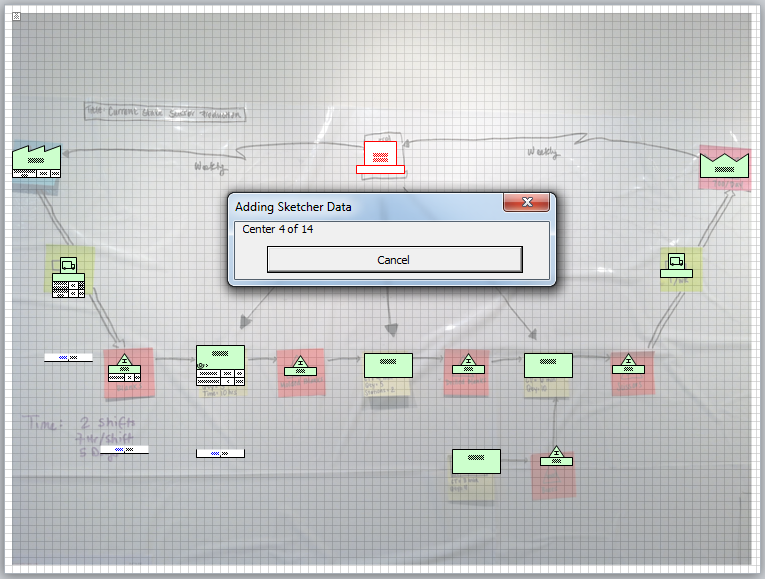
Auto-adding data
So copying data from the image can be pretty tricky, usually because it's hard to read handwriting when the pictures are usually taken from somewhat far away. Also the transparency doesn't help, but turning off the Visio grid can help. But we usually will just go post-it by post-it, and enter data.
After your sketch is complete, you can complete the transformation to a regular map, by using the Sketcher Align tool, which is also currently only in the Beta toolbar. This tool tries to recognize the spatial relationships between all the Sketcher shapes on the page, and lay the map out for you as you would if you had just used our quick stencils.

Aligned map
The Sketcher Align tool used to be in the main toolbar, but during our training sessions users really really hated it, but I think we've improved it since then. Once we got Undo to work with it, I think it became a little more popular, since it's not always great at aligning things. One thing to note here is, I actually copied the Sketch onto a new page, without the post-it picture as a background.
Thursday, November 14, 2013
eVSM Beta Toolbar
One thing we haven't previously made public (that I'm aware of), is a beta toolbar/ribbon in eVSM v6. This is where we keep some tools/features we're working on that aren't quite done yet. Sometimes they are done, and we don't believe them to be mainstream enough to warrant taking up space in the main eVSM ribbon/toolbar.
So with every copy of eVSM v6 we ship two ribbon/toolbar files, in the Program Files\eVSM\Setup\Solutions folder. The main ribbon is stored in the eVSMIconsLGR.xml, and contains the data for building just the main eVSM toolbar.
The second file, when shipped, is called eVSMIconsLGRDev.txt. If you want access to the beta ribbon, just rename that file's extension to XML, and the next time you start eVSM you'll see two new ribbons/toolbars in addition to the main eVSM ribbon. One is the eVSM Beta ribbon, and the other is a Developer Tools ribbon, for anyone who wants to build their own stencils.
I will start writing up some of the tools in the beta ribbon soon. Until then feel free to look around at them and if you want to know more about them feel free to contact me.
eVSM v6.31 Released
eVSM v6.31 was recently released, which includes some updates to several quick stencils, as well as some bug fixes in the software, and a little change to the XY Chart. The XY Chart now allows you to plot as a horizontal bar chart or vertical, with the default being vertical.
Friday, November 1, 2013
eVSM v6.30 Released
Subscribe to:
Posts (Atom)