I've been at eVSM for three and a half years, and have added a ton of cool functionality to the software.
Hardly anyone realizes this.
For that reason and many others, we've been focusing our attention on delivering a great self-paced learning environment for eVSM v9, which will all be released at the start of 2016. That's assuming everything goes well, anyway.
This new capability will allow us to first deliver great training for our main quick stencils, but over time we'll add more and more advanced tutorials that will expose many of the great tools we've worked on but never fully delivered.
Learn more at our LinkedIn user group:
https://www.linkedin.com/grp/post/3382476-6054686331278290948
Friday, October 2, 2015
Thursday, September 17, 2015
Transactional Demand River
Part of our improvements to the Transactional Pro capability in eVSM included an enhancement to our line thickness visualization gadget. Each green arrow in our transactional map now carries a variable for the demand flowing through it. The gadget uses this data to determine the line thickness.
So, the practical upshot is that it's easy to see how much demand is flowing through a system, even when there rework and splits/merges are involved. When this was shown to an improvement team, they ended up naming this the 'demand river', as it is somewhat akin to water flowing, splitting off, and flowing back together.
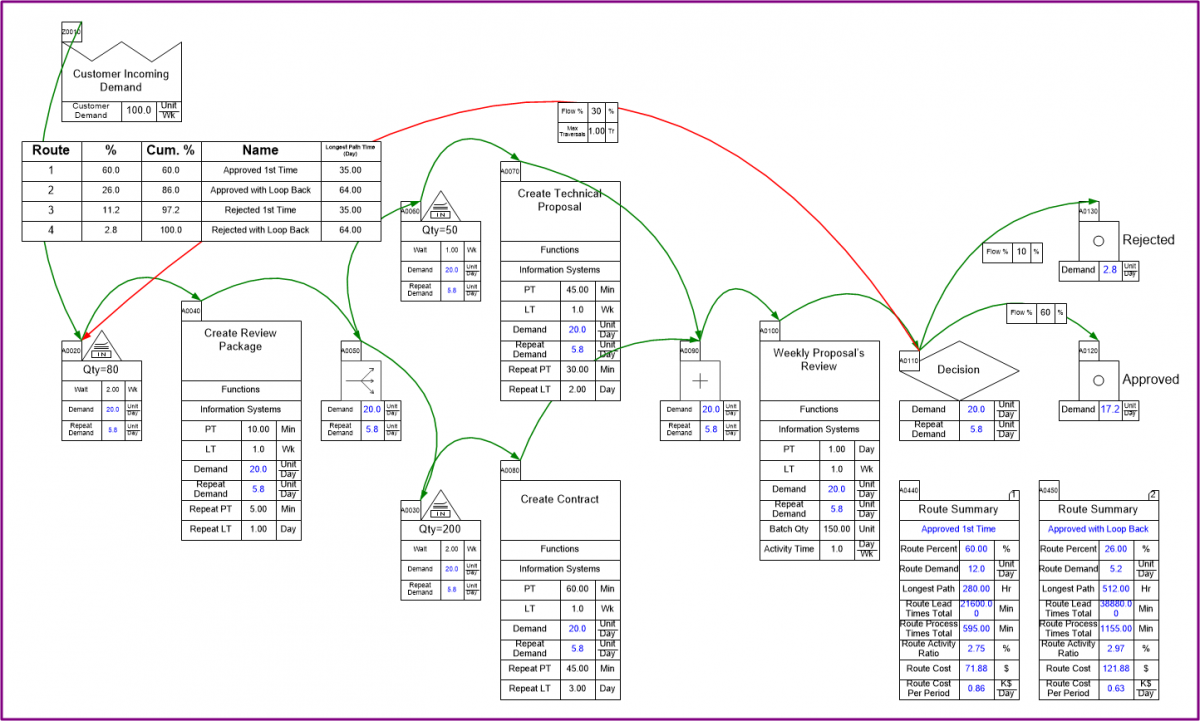
Below is an example future state map for a clinical approval process. The goal of the future state design was to make most of the requests finish with the shortest total lead time possible. We used the demand river to help show the improvement in routings. The big fat lines upstream flow quickly through some decision processes, and split off so that the less-common long-lead items are identified early, and the quick/easy items get approved as quickly as possible.

The underlying data is of course of great interest, but it's absolutely necessary to be able to show it to people visually. Great visualizations like the demand river really help people to understand what the map is showing, which makes it easier for people to reconcile that with the real world. This includes being able to point out mistakes in the map (and in the author's conception of the system) much easier than if you had to try and understand a bunch of data points.
Wednesday, September 16, 2015
Transactional Pro Update
My last post was back in March, and detailed some of the work we did for transactional value stream mapping and analysis. Shortly after that post, we revisited the stencil with some ideas on improving usability and performance.
Long story short, we changed the route table so that you could now have multiple route tables on a single page, and each one could be filtered to show only what you're interested in. For instance, you could easily see just the routes that represent more than X % of the total flow, or cost, in the system.
You can also configure a route table to show only certain variables, and leave out what you don't want, and sort by whatever variable you want.
We also re-factored the software so that you no longer have to re-run the simulation in order to re-draw the route table. You can just add route tables, slice and dice them, iterating quickly, without having to re-run the simulation.
Check out the tutorial for more information, and if needed get a trial download.
Thursday, March 19, 2015
eVSM Quick Transactional Pro
Last year we had a look at our Transactional mapping stencil, and compared its capabilities with example maps from Karen Martin & Mike Osterling's excellent Value Stream Mapping book. We were easilty able to replicate them in eVSM, though we found some of the calculations differed, mainly how lead time is calculated.
Our Quick Manufacturing stencil calculates lead time for inventories based on Little's Law, which is totally reasonable and appropriate for discrete manufacturing. Rather than get into the nuances here, I guess I'll just link Karen's post on the topic because this post is supposed to be about what we did about our findings with the Transactional stencil.
So we looked at everything we did for mapping transactional value streams, and decided the biggest deficiency we had was in handling rework loops. We provided a very basic calculation for rework and left it at that, not even really having it impact lead time, just cost.
In the end we decided to try allowing loops in analyzing transactional value streams. We also had started implementing some calculations for parallel processing in the old Quick Transactional stencil, but wanted to provide full support for it going forward.
What came out of all this work is a new stencil, and a lot of supporting code, called Quick Transactional Pro. The stencil allows you to draw a transactional map with constructs available for multiple rework loops, document splitting and merging, and various termination points. We used constructs from Business Process Modeling Notation (BPMN), specifically: split, merge, and terminate centers.
We tried to make the modeling job as easy as possible, so we end up assuming that the repeat process and lead times are the same as the first-time, but you can add repeat time data when the repeat processing is faster (or slower) than the first time through a process.
Once the map is built you use the Solve tool, which works a bit differently than normal on these types of maps. Rather than perform static Excel calculations, like all our other stencils, we run a three-stage solve. The first stage pre-populates some simple calculations, needed for the second phase. The second phase is a small scale simulation, where we generate some number of 'flow tokens' (250 by default), and send them one-by-one through the value stream. We track the whole route each token takes, and identify every unique route taken. We also count the number of tokens that follow each route.
This flow data is then passed to the third phase of the solve, which uses that flow data first to calculate the First-Time and Repeat demand at every single center in the value stream. This allows us to get a better idea of the actual demand faced by different resources in the value stream, and what capacity is required to serve demand.
The flow data also gets used in the third phase, to give route-specific lead times. We use the flow data to generate what we call a Route Table, which shows all the unique routes identified by the simulation, sorted from highest percentage of flow to the lowest.


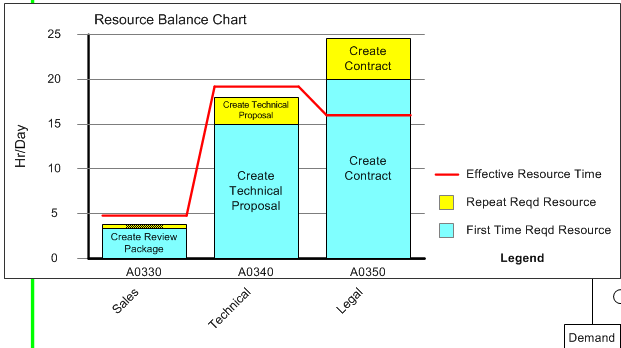
You can also assign resources across processes, and see a balance chart:
Our Quick Manufacturing stencil calculates lead time for inventories based on Little's Law, which is totally reasonable and appropriate for discrete manufacturing. Rather than get into the nuances here, I guess I'll just link Karen's post on the topic because this post is supposed to be about what we did about our findings with the Transactional stencil.
So we looked at everything we did for mapping transactional value streams, and decided the biggest deficiency we had was in handling rework loops. We provided a very basic calculation for rework and left it at that, not even really having it impact lead time, just cost.
In the end we decided to try allowing loops in analyzing transactional value streams. We also had started implementing some calculations for parallel processing in the old Quick Transactional stencil, but wanted to provide full support for it going forward.
What came out of all this work is a new stencil, and a lot of supporting code, called Quick Transactional Pro. The stencil allows you to draw a transactional map with constructs available for multiple rework loops, document splitting and merging, and various termination points. We used constructs from Business Process Modeling Notation (BPMN), specifically: split, merge, and terminate centers.
We tried to make the modeling job as easy as possible, so we end up assuming that the repeat process and lead times are the same as the first-time, but you can add repeat time data when the repeat processing is faster (or slower) than the first time through a process.
Once the map is built you use the Solve tool, which works a bit differently than normal on these types of maps. Rather than perform static Excel calculations, like all our other stencils, we run a three-stage solve. The first stage pre-populates some simple calculations, needed for the second phase. The second phase is a small scale simulation, where we generate some number of 'flow tokens' (250 by default), and send them one-by-one through the value stream. We track the whole route each token takes, and identify every unique route taken. We also count the number of tokens that follow each route.
This flow data is then passed to the third phase of the solve, which uses that flow data first to calculate the First-Time and Repeat demand at every single center in the value stream. This allows us to get a better idea of the actual demand faced by different resources in the value stream, and what capacity is required to serve demand.
The flow data also gets used in the third phase, to give route-specific lead times. We use the flow data to generate what we call a Route Table, which shows all the unique routes identified by the simulation, sorted from highest percentage of flow to the lowest.
The route table is a great way to tell at a glance what are the most common routes through the value stream, and their corresponding lead times. You can also drill down a little further into a single route with the Route Summary, which shows costs associated with a route, the demand, and the Activity Ratio, which is the ratio of Activity Time to Lead Time.
You can right-click on any row and view what activities are part of the route, and you can also see an animated view of the 'token' flowing through. If you want to know your first-pass C&A you would find the route where tokens flow through without rework, and get the flow %.
We also include a few charts, including a lead time ladder chart showing lead components for different routes:
This stencil has been out since last summer, but I've only now gotten around to talking about it. There are a few more exciting new tools in eVSM that I hope to write about sooner.
Quick Transactional Pro is a new way of thinking about mapping transactional value streams, and I can't think of an easier way to see transactional systems when there are loops and parallel processing.
Give eVSM v8 a try now, which includes Quick Transactional Pro. If it's been a while since you've tried eVSM, try it again.
Subscribe to:
Posts (Atom)